

Horizons: Navigating Tariffs and Trade Winds
As trade tensions redefine the Seaway in 2026, stakeholders must look not only at current disruptions but on and over the horizon—where evolving tariffs will shape volumes, jobs and competitiveness.
The Evolving Tariff Environment
The tariff regime in early 2026 stems from executive actions started in 2025, marking a significant shift from the relative stability of the U.S.-Mexico-Canada Agreement (USMCA), which replaced NAFTA in 2020. In January 2025, the United States imposed a 25% tariff on all imports from Canada and Mexico, with a reduced 10% rate on oil and energy products to mitigate immediate energy price spikes.
This move, part of a broader “America First” trade policy, aimed to address perceived trade imbalances and protect domestic industries like steel and manufacturing. However, it has strained binational ties, with Canada retaliating through targeted duties on U.S. goods.
Key changes include sector-specific tariffs on steel and aluminum, reviving measures from President Trump’s first term. These duties, initially set at 25% on steel and 10% on aluminum, were briefly postponed in early 2025 for negotiations but fully enacted by April.
Additionally, President Trump has threatened 100% tariffs on Canadian imports if Canada deepens trade ties with China, prompting Canada to pivot toward Europe and Asia for diversification.
Internationally, tariffs extend beyond North America. U.S.-China trade tensions eased slightly with a reduction from 25% to 10% on select goods in late 2025, but broader levies on imports transshipped through allies remain.
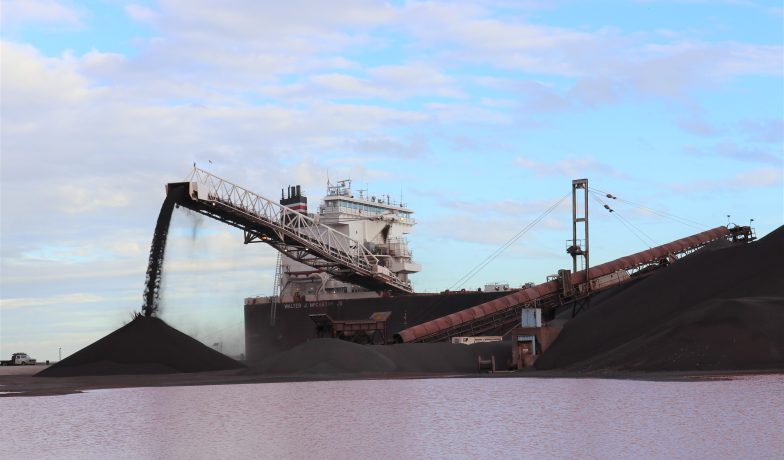
For the Seaway, which handles over 37 million metric tons of cargo annually, these policies disrupt established supply chains. Opposition from Great Lakes stakeholders, including carriers, highlights potential hikes in shipping costs and supply chain disruptions.
Higher tariffs, or taxes, fees and costs are either passed on to the next link in the value supply chain or absorbed by the person paying those. Inevitably, there is a cost someplace. Those costs affect business and financial decisions.
The framework for tariffs follows these pathways:
- Tariffs → higher cost of steel inputs → U.S. plant throughput changes → Seaway routing impacts
- Retaliation → reduced U.S. exports → grain and general cargo volatility
- Energy tariff exceptions → temporary cushioning → long-run risk if expanded
The USMCA’s six-year review, scheduled for mid-2026, looms as a pivotal moment that could either stabilize or exacerbate these issues.
Impacts on Commodity Flows: Disruptions and Shifts
Tariffs have already begun altering commodity movements through the Great Lakes-St. Lawrence Seaway, affecting U.S.-Canada cross-border trade and global inflows. The system, which moves grain, iron ore, steel, coal and other bulks, saw mixed results in 2024—pre-tariff baseline—before the full weight of 2025 policies hit.
Despite the tariffs however, cargo movements during 2025 proved resilient with total volumes increasing slightly to 37 million metric tons. It is important to point out that cargo volumes have been stagnant averaging 37.3 million metric tons since 2020, ranging from 36.3 million metric tons in 2022 to 38.2 million metric tons in 2021. The highest volume of cargo moved was in 1999 (when data is last available from The St. Lawrence Seaway Management Corporation) at 47.8 million metric tons.
Tariff impacts on cargo volumes are not yet appearing as much as a recession does. The great recession from 2008 to 2009 saw cargo volumes collapse more than 10 million metric tons to a historical low of 30.7 million as shown in Figure 1. 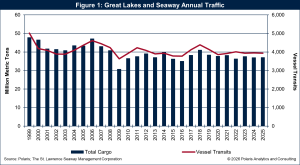
Grain led cargo volumes higher for the third consecutive year, up more than 1 million metric tons during 2025 to 12.9 million. As a commodity group, grain is the highest volume moved on the Seaway with more than 30% of the volume. However, the decline in coal and general cargo movements offset the gains of grain cargo.
Coal volumes used to be 10% of the volume and have been slashed in half as global coal usage declined dramatically for environmental reasons. Iron ore movement was one-fourth of total volumes from 2007 to 2013 and have been declining steadily since to 16% during 2025. The five-year share of cargo volumes moved on the Seaway is presented in Figure 2.
Steel and aluminum flows, critical to the automotive and manufacturing sectors, face direct hits. U.S. tariffs on Canadian steel have constrained domestic volumes, disrupting integrated supply chains where Canadian mills supply U.S. plants via the lakes. This has led to higher costs and delays, with some shipments rerouted to avoid duties. Energy products, like Canadian oil transiting the lakes, benefit from lower tariffs but could see price hikes if broader duties apply, raising U.S. transportation costs. 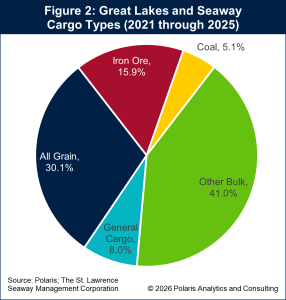
Broader international trade feels the ripple: Tariffs on Chinese goods have spurred volatility in containerized imports, indirectly affecting Seaway-bound cargoes. Despite steady volumes moving, tariff and policy uncertainty with higher import fees and trade disruption paint a less than confident growth story for volumes moved on the Seaway.
Looking Ahead
The outlook for 2026-2027 remains clouded by uncertainty, with trade wars poised to persist. Analysts project modest growth in dry bulk volumes, supported by global industrial demand, but tariffs could drag overall Seaway traffic lower if unresolved. Grain has upward momentum, buoyed by a strong U.S. corn and improving wheat export outlook and diversification, while steel and iron ore face demand constraints. The USMCA review could restore stability, but failure risks deeper fractures.
Economically, the stakes are high. The Great Lakes-St. Lawrence Seaway system supports more than 147,000 U.S. jobs and generates $26 billion in regional revenue annually. Tariffs are projected to reduce U.S. GDP by 0.5%, inflate prices by 2.3%, and cost households $3,800 on average. Canada faces similar pain, with affected sectors down 3.2% in 2025 and growth potentially slashed by 2 percentage points.
Yet positives emerge: $8.4 billion in infrastructure investments through 2027 aim to boost efficiency and attract new trade. Cruise traffic is expected to inject millions, supporting tourism jobs. Diversification strategies mitigate losses.
In sum, tariffs pose uncertainty to Great Lakes trade, but strategic investments and diplomacy offer a path over the horizon. Stakeholders must advocate balanced policies to safeguard this economic powerhouse.
Feature photo courtesy of Lake Carriers’ Association


Phase II Expansion Completed at DeLong Agricultural Export Facility in Milwaukee
Soybean farmer leaders presented a ceremonial $200,000 check March 31 in Milwaukee to support the Phase II expansion of the Agriculture Maritime Export Facility at Port Milwaukee. The facility, owned... Read More
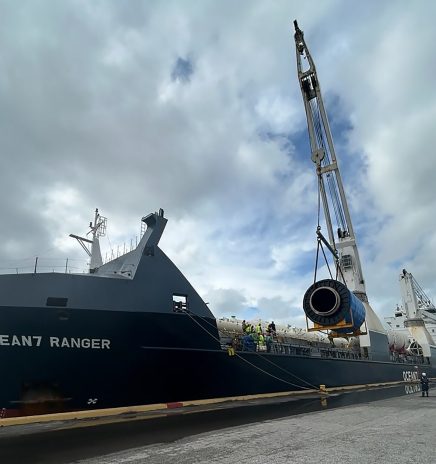
Great Lakes Ports Mark Start of 2026 International Shipping Season
The Ocean7 Ranger arrived at Ports of Indiana-Burns Harbor on April 4, marking the official start of the 2026 international shipping season. The vessel completed a 52-day voyage to deliver... Read More