

St. Lawrence Seaway Cargo Traffic Down Nearly 7% Through April
Total cargo volume reached 4.08 million metric tons through April 2026, compared with 4.377 million metric tons during the same period last year.
Grain shipments posted one of the largest declines among cargo categories. Total grain traffic reached 1.279 million metric tons, down 19.89% from 1.597 million metric tons in 2025. Coal shipments also fell, declining 28.46% to 114,000 metric tons from 160,000 metric tons a year earlier. Liquid bulk cargo decreased 12.44% year over year, totaling 534,000 tons compared with 610,000 tons in 2025.
Some cargo sectors recorded gains during the first part of the navigation season. Iron ore shipments increased 11.81% to 577,000 metric tons, while dry bulk cargo rose 1.03% to 1.238 million metric tons.
General cargo posted the largest percentage increase among the reported categories, rising 25.49% to 337,000 metric tons from 269,000 metric tons in 2025.
The number of vessel transits on the system also declined. Total transits reached 438 through April, down 6.41% from 468 during the same period last year.
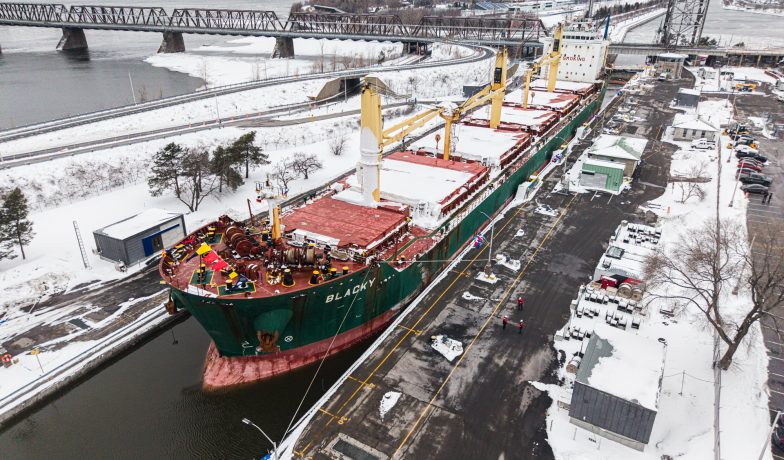
Feature photo: M/V Blacky at St. Lambert Lock/Photo courtesy of SLSMC

Cargo Volumes Down Despite Increased Vessel Activity on the St. Lawrence Seaway
Cargo volumes on the St. Lawrence Seaway remained below last year’s pace through June, although vessel traffic continued to increase, reflecting a mixed start to the 2026 navigation season. According... Read More
Great Lakes Limestone and Iron Ore Trade Up in June
U.S. shipments of limestone on the Great Lakes totaled 3 million tons in June, an increase of 4.5% compared to June 2025. According to the Lake Carriers’ Association (LCA), this... Read More