

St. Lawrence Seaway Cargo Traffic Holds Steady During 2025 Navigation Season
The system handled 36.9 million metric tons of cargo in 2025, essentially unchanged from the previous year. Vessel transits totaled 3,931, a slight decrease of 0.5% compared with 2024.
Bulk cargo continued to represent the largest share of traffic, accounting for 20.5 million tons, or about 55% of all cargo moved through the Seaway. Bulk volumes declined slightly, down 0.3% from the previous year.
Commodity Increases
Grain shipments were a key driver of activity during the season. Grain cargo totaled 12.9 million metric tons, an increase of 9.3% year over year and representing nearly 35% of total cargo handled by the system.
Wheat remained the largest single commodity moved through the Seaway at 7.66 million metric tons, followed by corn at 2.07 million metric tons and soybeans at 1.45 million metric tons.
Commodity Declines
Traffic in several other commodity groups declined. Coal shipments totaled 1.58 million metric tons, down 16.3% compared with the prior season. General cargo volumes also dropped, falling 14.7% to about 1.87 million metric tons.
Mining-related commodities remained a significant component of Seaway traffic. Iron ore shipments reached 4.92 million metric tons, while salt shipments totaled 3.06 million metric tons, an increase of nearly 34% year over year.
Processed products accounted for about 10.26 million metric tons of cargo, including petroleum products, chemicals and iron and steel shipments. Overall, processed cargo volumes declined 8.4% compared with 2024.
Traffic through the system was split between upbound and downbound movements, with downbound cargo totaling about 25.5 million metric tons and upbound shipments totaling about 11.4 million metric tons.
Cargo vessels accounted for the vast majority of activity on the system. Gross registered tonnage for cargo vessels reached 52.7 million metric tons, a 2.7% increase from the previous year. Non-cargo vessels, including passenger vessels, represented a smaller share of traffic at about 1.25 million gross registered metric tons.
Total toll revenue for the 2025 navigation season reached $86.9 million, an increase of 1.1% compared with 2024.
The navigation season began March 22, 2025, and the final commercial vessel cleared the system January 11, 2026, in the Montreal–Lake Ontario section and January 13, 2026, in the Welland Canal section. The season lasted 296 days and 298 days respectively for the two sections.
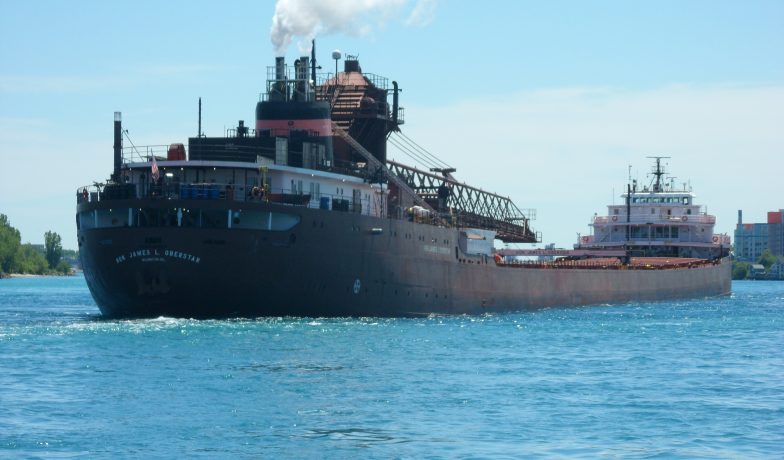
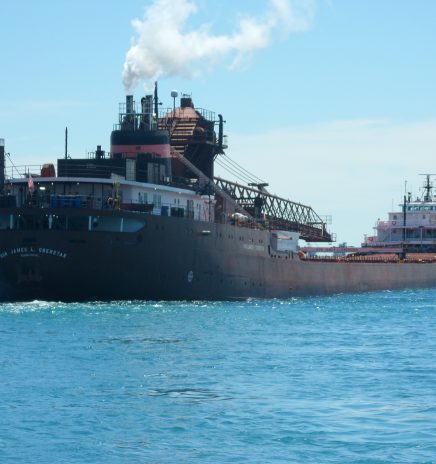
Feature photo: Hon. James L. Oberstar/photo by Ed Bansek

St. Lawrence Seaway Cargo Traffic Holds Steady During 2025 Navigation Season
Cargo traffic through the St. Lawrence Seaway remained largely unchanged during the 2025 navigation season, with increases in grain shipments offsetting declines in several other cargo categories. The system handled 36.9 million metric tons of... Read More
Advancing Agricultural Prosperity Among Great Lakes Shippers and Suppliers
Meeting for the second time in Grand Rapids, Michigan, on Dec. 4, 2025, the Great Lakes Alliance for Sustainable Shipping (GLASS) drew more than 80 attendees from across the Midwest agriculture and transportation industries. Those attending included trucking companies, marine... Read More